From time to time, people ask me whether it is possible to gain insight into the build performance of a C++ project. Using a tool like Ninja to efficiently build in parallel is usually an easy first step. The next focus is usually how to improve the efficiency of the parallel build. Developers are usually interested in which files are taking longer than expected to compile or link. Such files may be good candidates for reducing build time through refactoring or reducing header includes. Custom tasks might also be taking longer than expected, but this can be hard to spot in the build output in highly parallel builds. There are tools which can make this task much less daunting. This article briefly introduces some techniques and tools which can provide considerable insight with fairly minimal effort.
Estimated reading time: 4 minutes
Ninja Tracing
For CMake projects, the Ninja generator is particularly convenient for producing this sort of information. Ninja tracks how long each build task takes and records it in a file called .ninja_log. A tool called ninjatracing (which is a single python script) can then process that file to produce a JSON file. Some IDEs and web browsers can then load those directly for interactive analysis. For example, enter about:tracing in the Chrome browser and you’ll get a UI in which these files can be loaded and viewed interactively.
As an example, here’s the set of steps and sample results for a build of CMake’s source code on a 2021 M1 Max MacBook Pro (see below for the raw data):
cd path/to/build/directory
rm .ninja_log
ninja
python3 ninjatracing .ninja_log > cmake_build_trace.json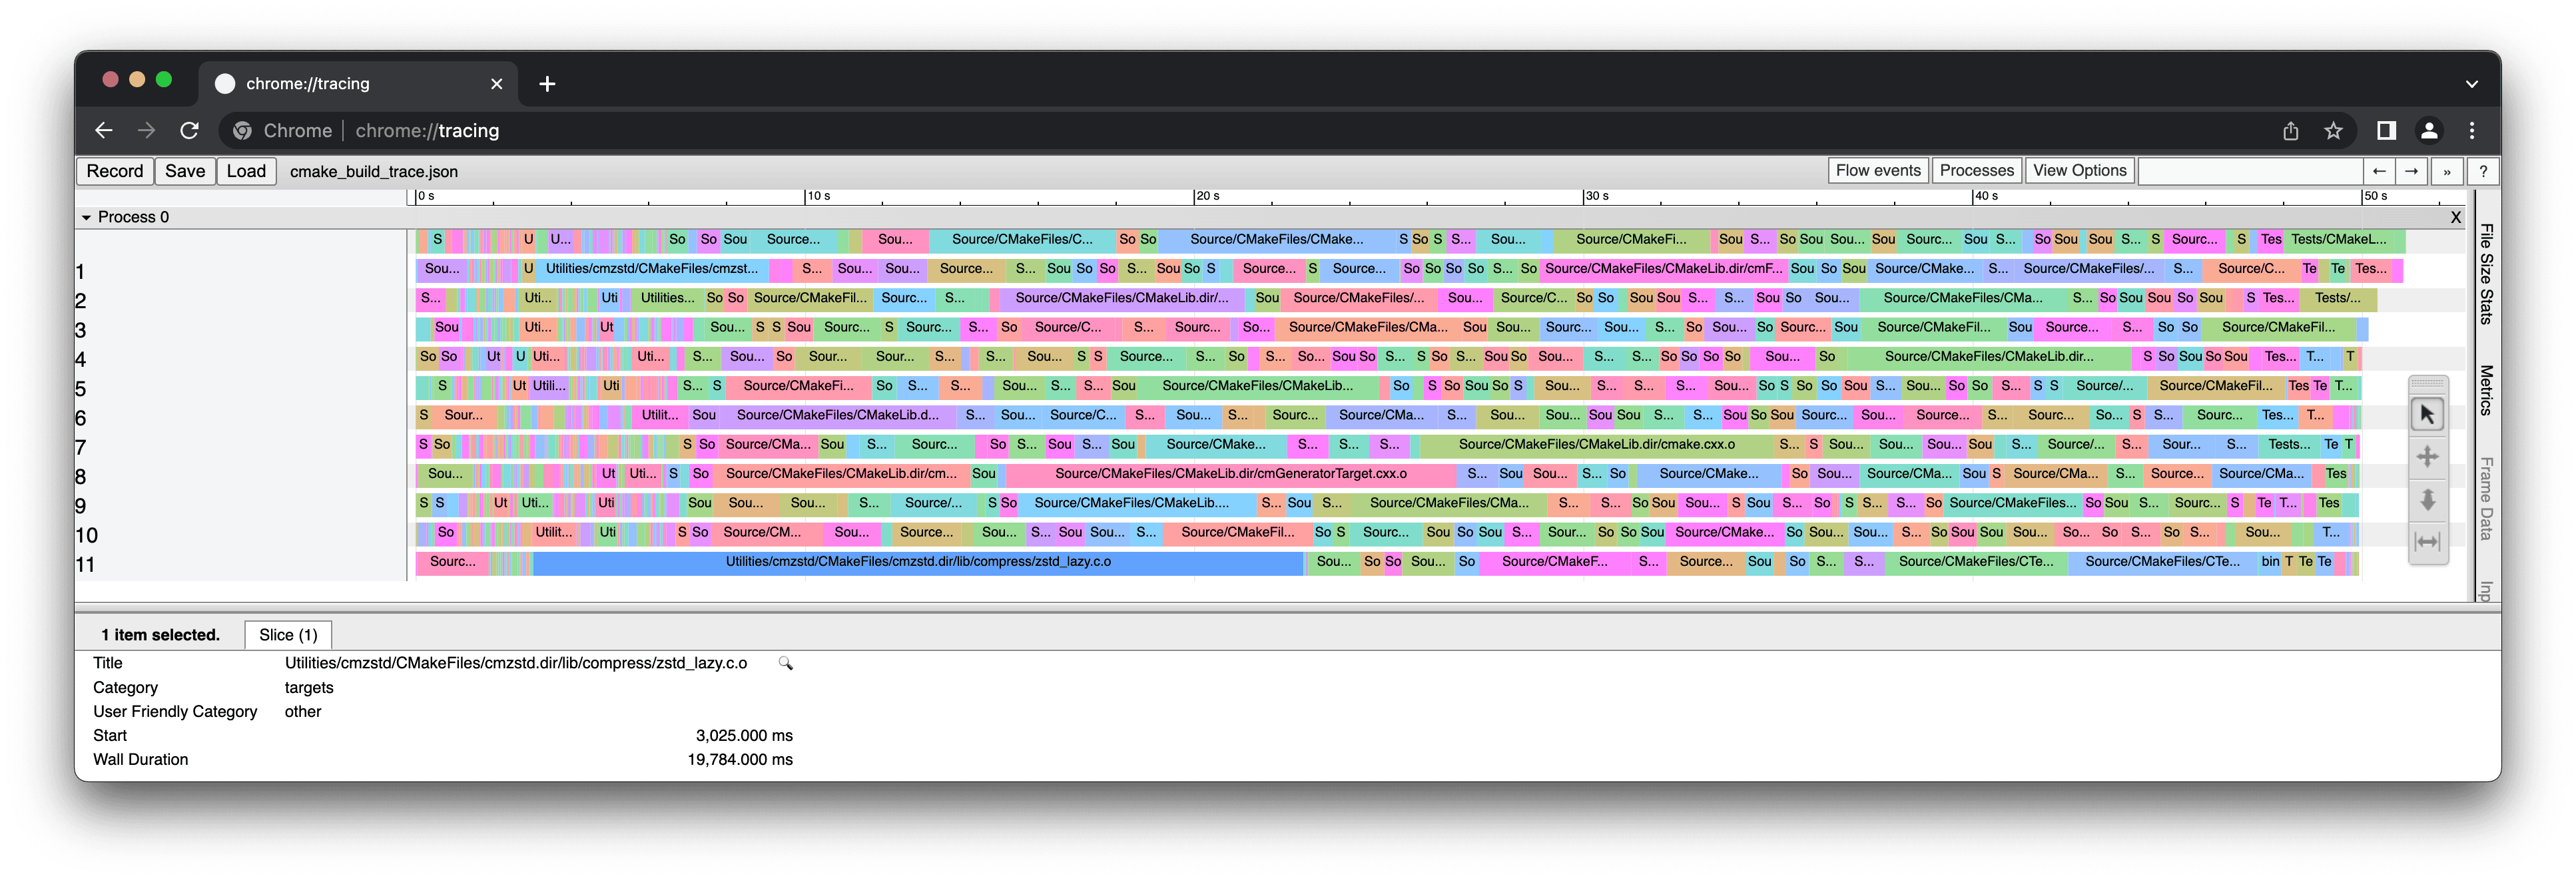
Clang Time Tracing
If you are using Clang 9 or later as your compiler (or Apple Clang), you can add the -ftime-trace compiler option to record fine-grained details about where the compiler spends its time for each file. The ninjatracing tool also knows how to read the data that Clang produces. Add the -e option to the ninjatracing command and it will include the Clang trace data in the whole build’s tracing results. This gives an incredibly detailed insight into the build performance.
cd path/to/build/directory
cmake -DCMAKE_C_FLAGS=-ftime-trace -DCMAKE_CXX_FLAGS=-ftime-trace .
rm .ninja_log
ninja
python3 ninjatracing -e .ninja_log > cmake_build_trace_detailed.json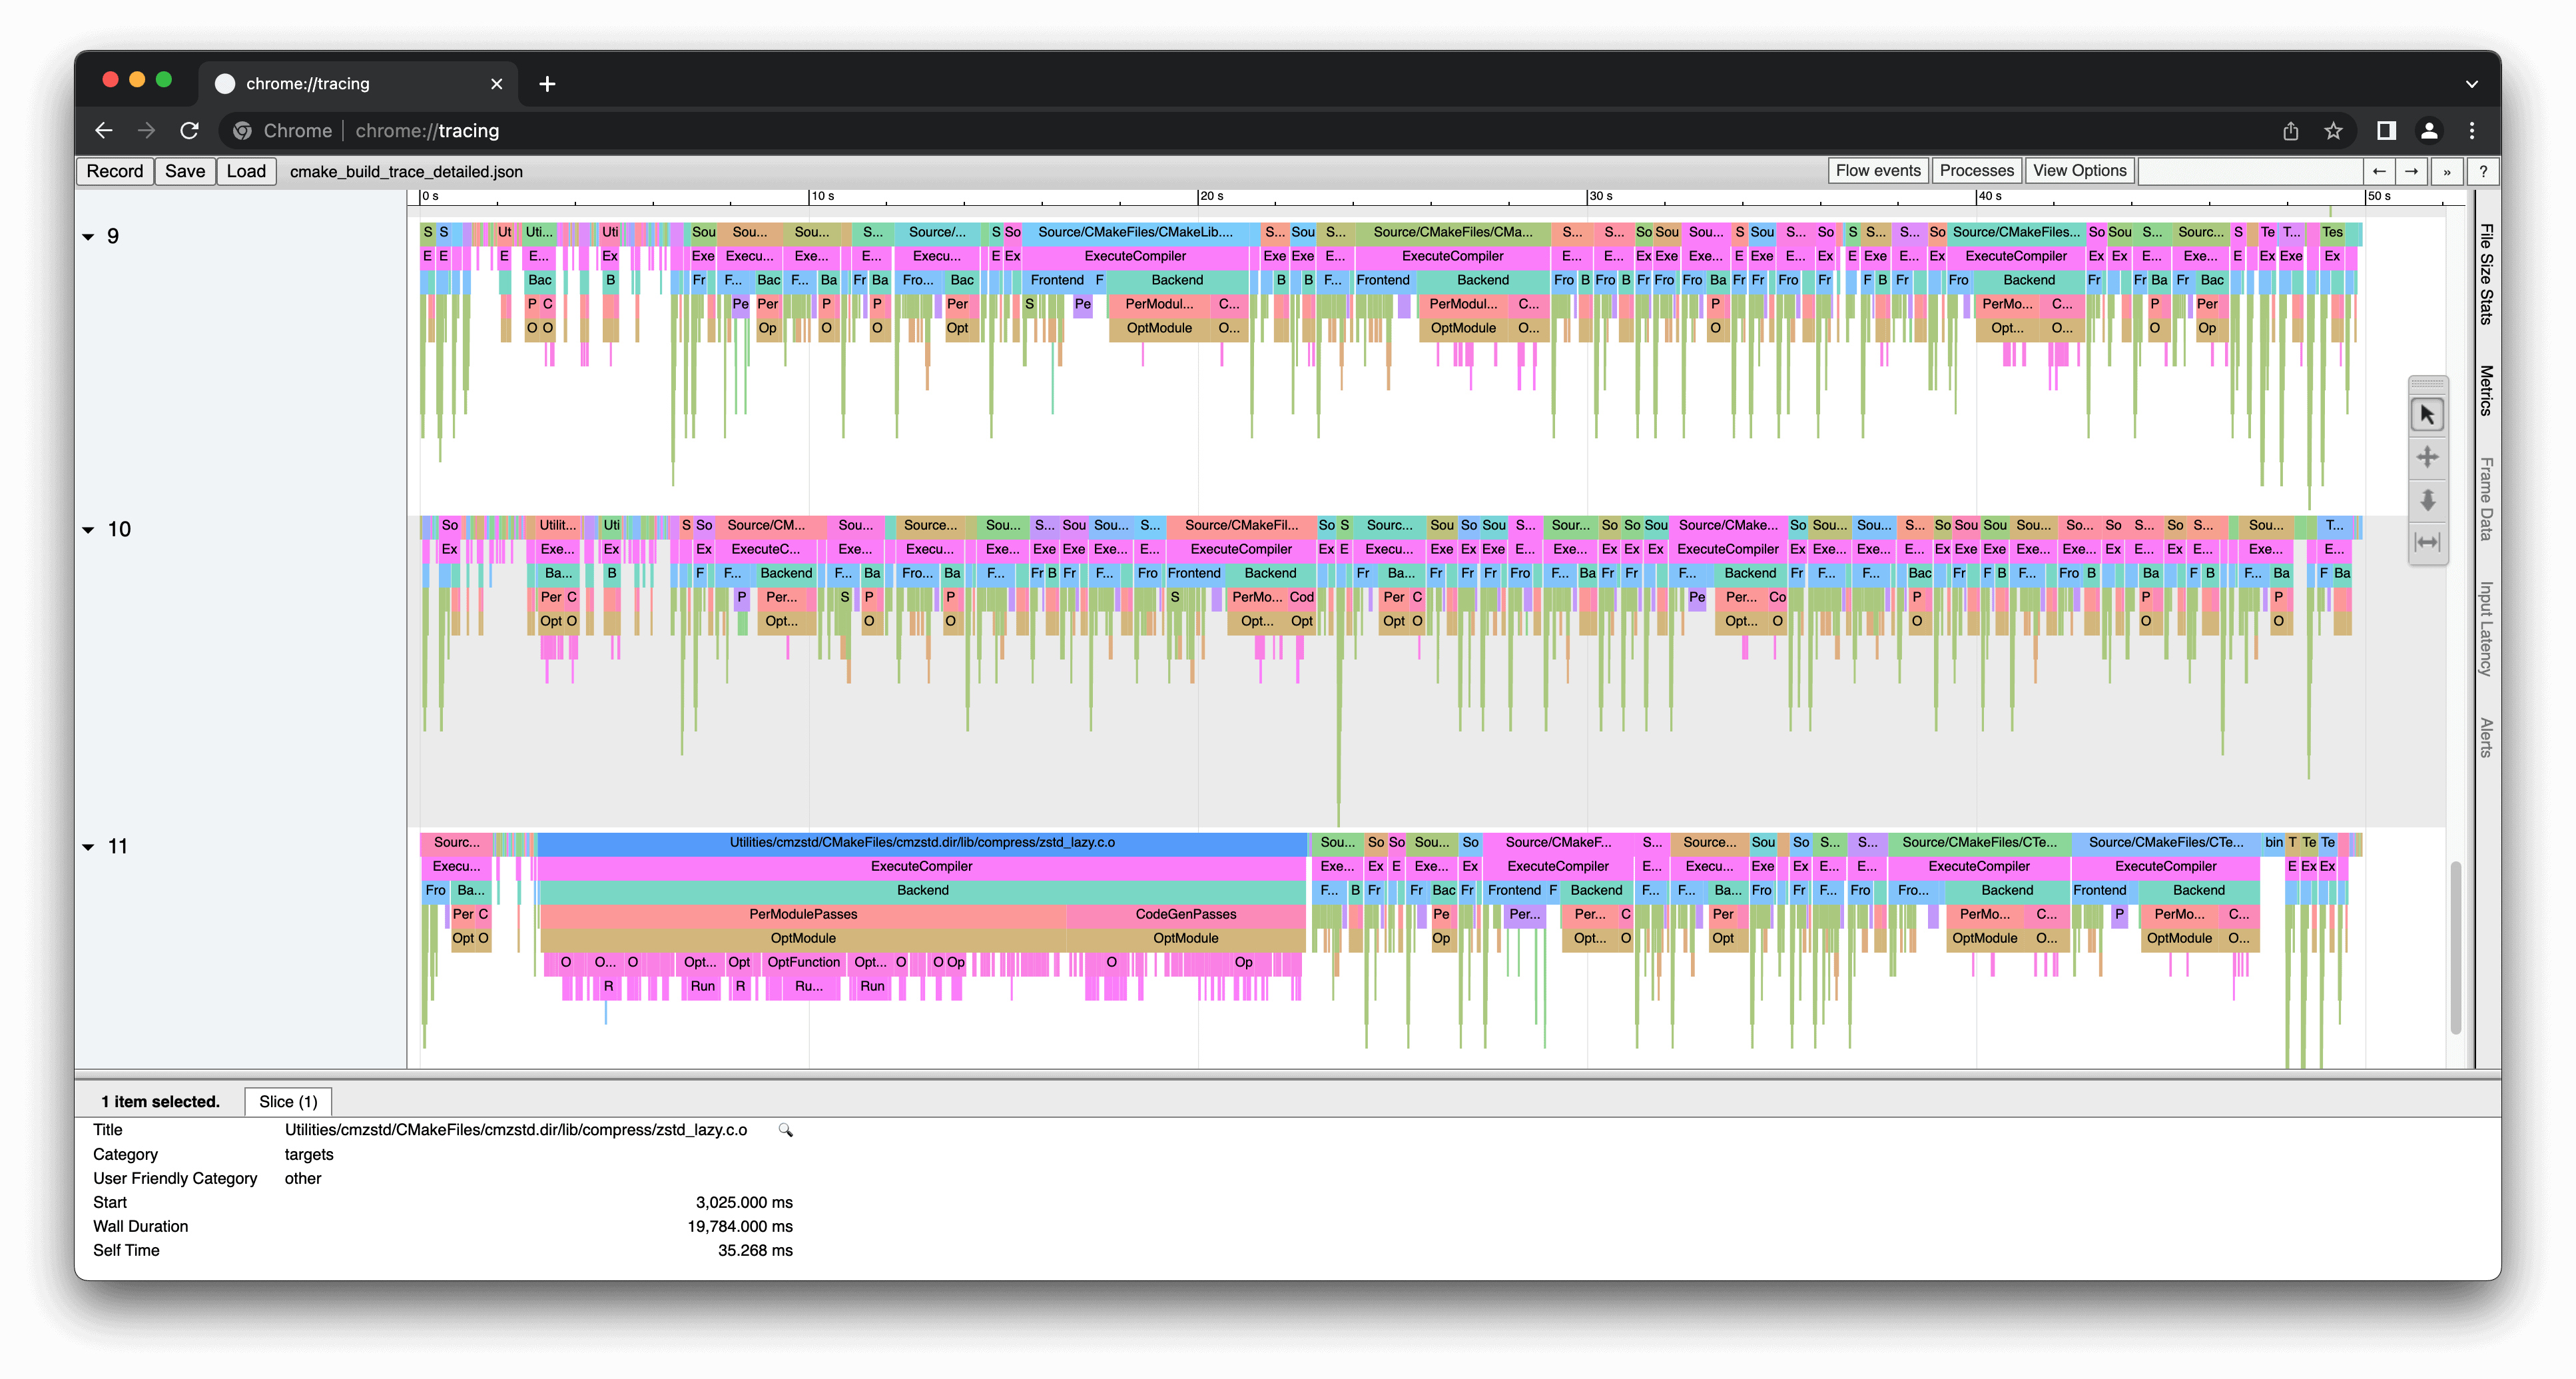
The above example shows that Clang isn’t spending a huge amount of time reading CMake’s sources and headers. These are the very thin green vertical strips in the results. Compare this with the results of compiling the open source dlib project:
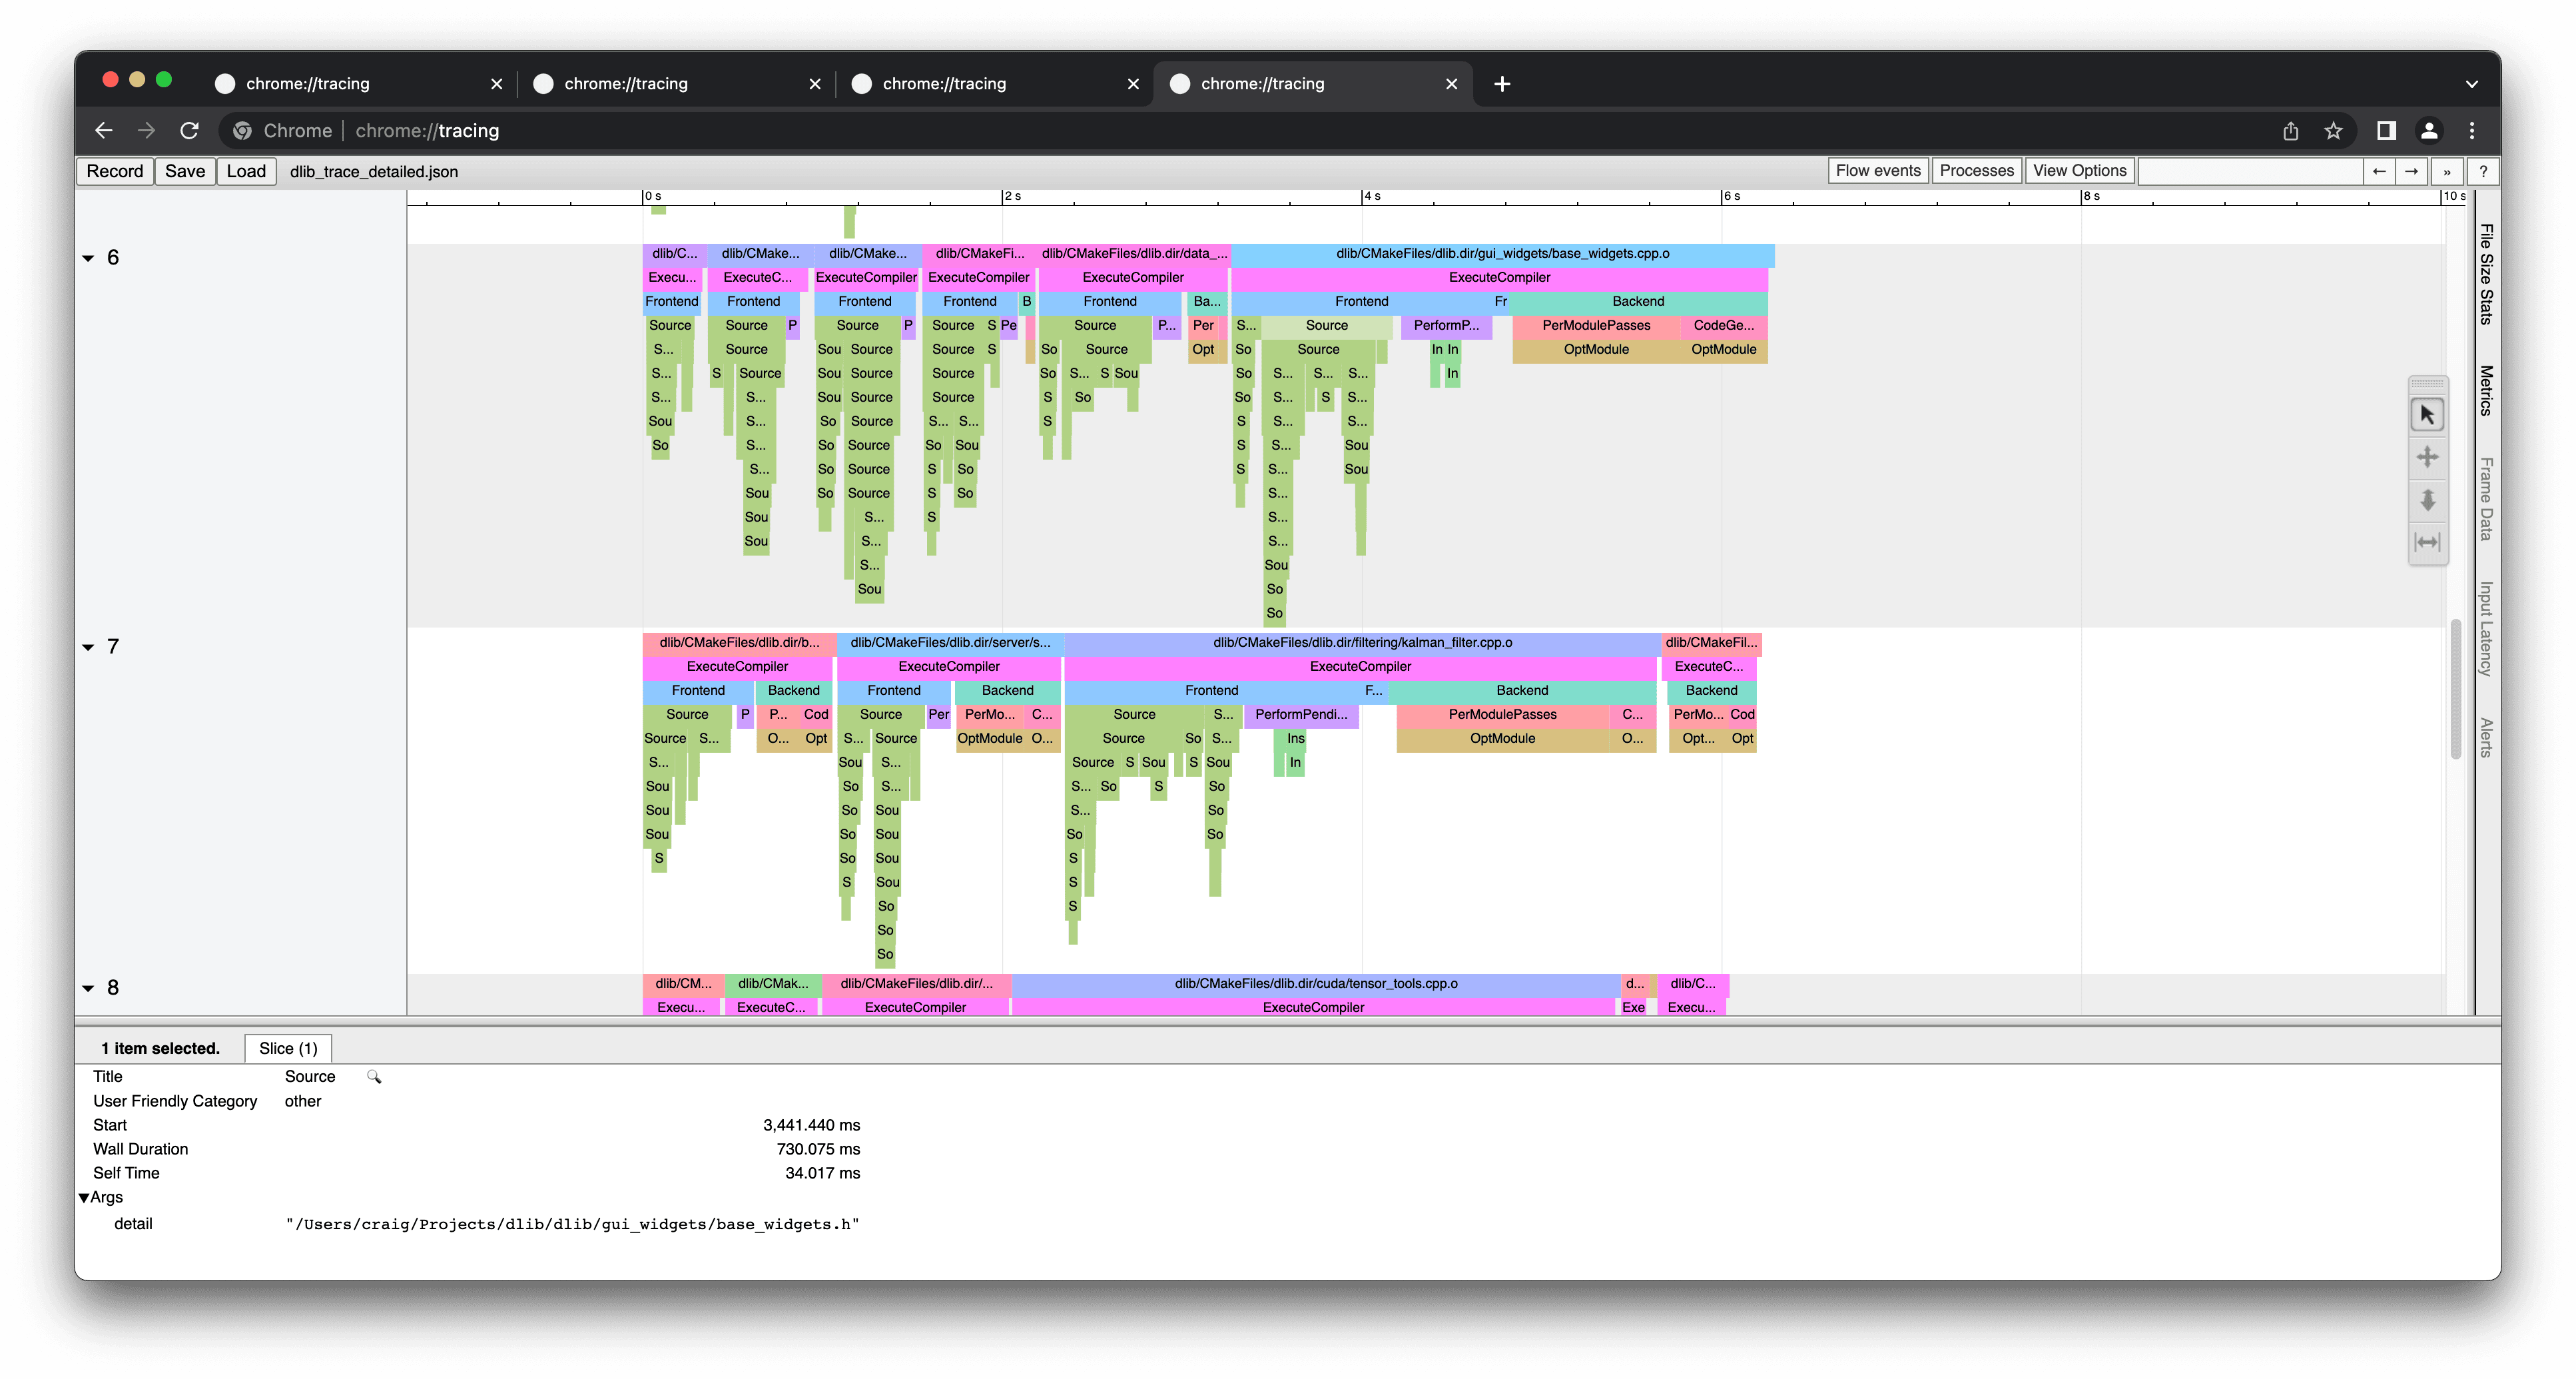
Even accounting for the different time scales in the two images, it is clear that Clang is spending proportionally more of its time reading sources and headers. This represents an opportunity for improving the build performance, since there are often things one can do to reduce the headers pulled in by a source file:
- Look for defining too many things in the one header. Aim for one header, one responsibility. For example, define each C++ class in its own header instead of combining multiple classes in the one header.
- In the project’s headers, use forward declarations to define symbols that don’t need a full definition. This can reduce the number of other headers a particular header includes.
- If a class isn’t constructed and destructed many times in a critical code path, you might consider hiding that class’ private members behind a pointer. This is the classic “Pimpl” (pointer-to-implementation) idiom, which can be very effective at reducing the coupling between headers. Incremental builds will also likely be faster thanks to the reduced coupling.
Template-heavy code may also show certain files where template instantiations are a significant consumer of build time. This may be harder to spot, but this sort of tooling would be a great help to uncover and investigate that.
Raw Data
The raw .ninja_log and JSON files used to produce the above images and a couple of others for Qt and nlohmann-json are available in this archive. After unpacking it, you can load the JSON files in Chrome’s about:tracing page or with your preferred tool. I encourage you to explore the various data sets. Each one has different characteristics, so they are interesting to compare. Looking at the build performance of different projects can give you ideas for how to potentially improve your own project.
Note that there is no Clang time tracing data for the Qt data set. Unfortunately, the ninjatracing tool failed to parse that output due to an unexplained bug.
References And Further Reading
- https://aras-p.info/blog/2019/01/16/time-trace-timeline-flame-chart-profiler-for-Clang/
- https://aras-p.info/blog/2019/01/21/Another-cool-MSVC-flag-d1reportTime/ (little-known MSVC flag for timing/profiling)
- https://github.com/microsoft/vcperf (for use with the MSVC toolchain)
And of course, if you aren’t already using a compiler cache, definitely check out my earlier article for some potentially big performance gains: Using ccache with CMake